 Free
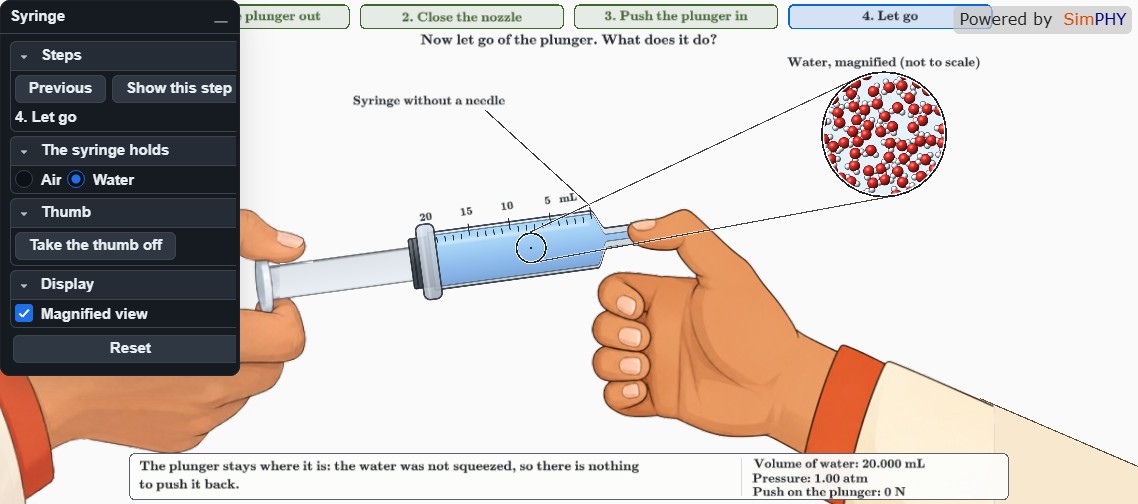
Compressing Air and Water in a Syringe
Fluid MechanicsPull the plunger, seal the tip, and see air compress while water remai...
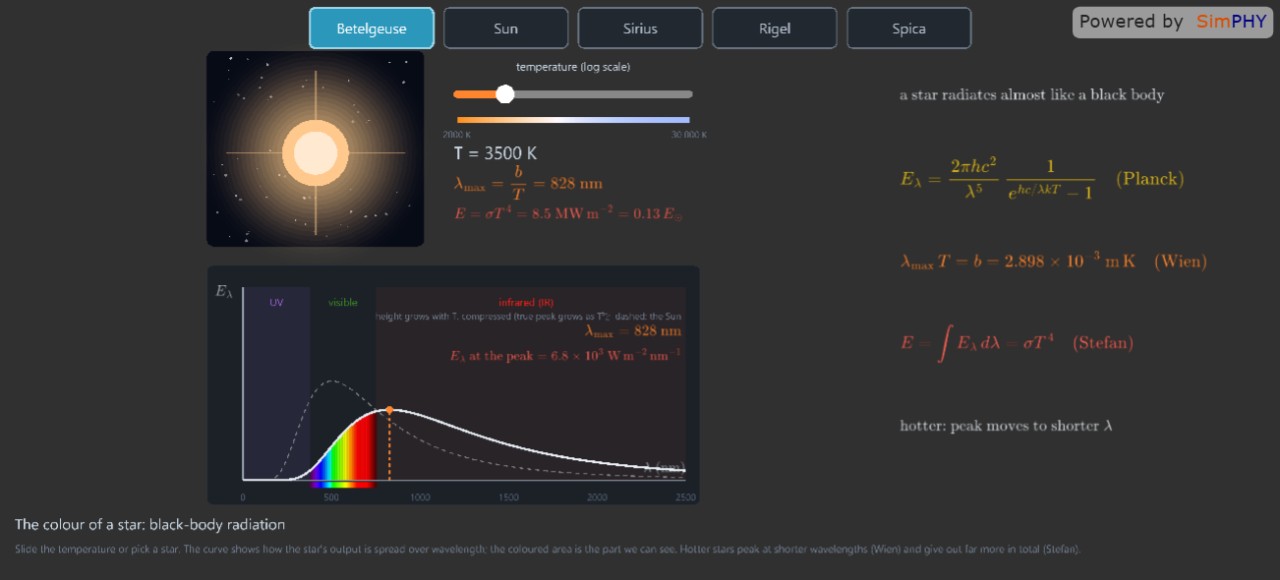
Watch how a star’s temperature changes its colour, spectrum peak, power via Wien’s and Stefan‑Boltzmann laws.
A star approximates a perfect black body, emitting radiation described by Planck’s law. The simulation plots the spectral emissive power versus wavelength, highlighting the visible band in its natural colours and marking the ultraviolet and infrared regions. The peak wavelength follows Wien’s law, and the total emitted power follows the Stefan‑Boltzmann law.
Students can select a preset star (Betelgeuse, Sun, Sirius, Rigel, Spica) or drag the temperature slider from 2000 K to 30 000 K. As the temperature changes, they observe the star’s colour shift, the movement of the spectrum’s peak to shorter wavelengths, and the increase in overall power. The board displays the corresponding Wien and Stefan values.
Through this interactive view, learners connect temperature to colour, understand how the spectrum shape reflects physical laws, and see quantitative evidence of the T⁴ dependence of radiated energy and the λ_max T constant of Wien’s law.
Free
Pull the plunger, seal the tip, and see air compress while water remai...
 Free
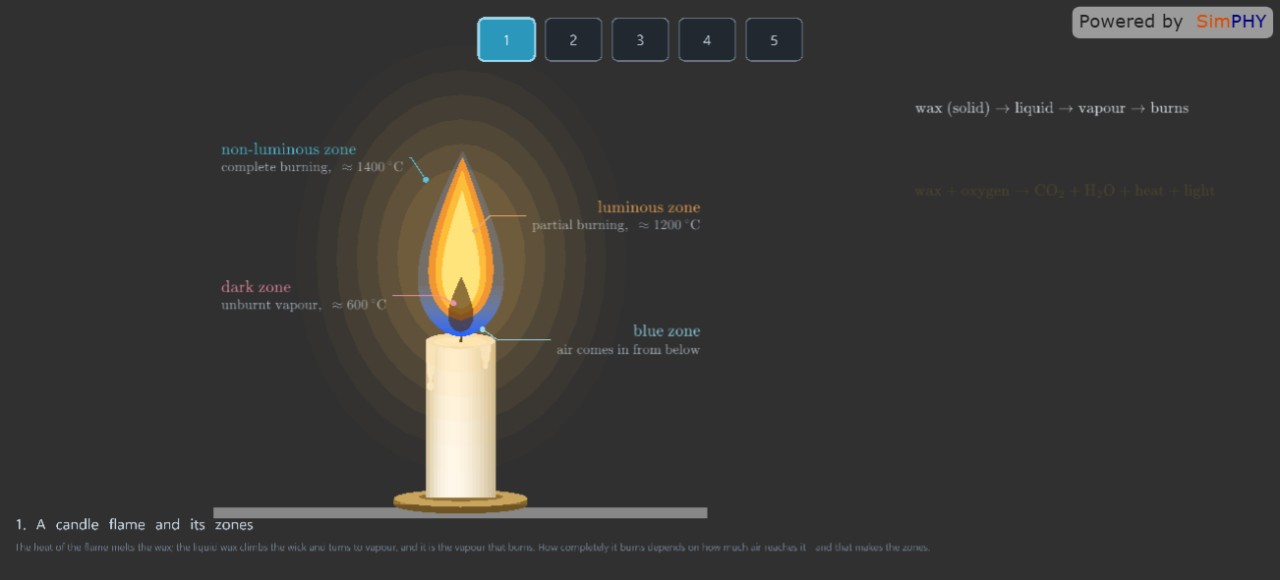
Explore the distinct zones of a candle flame—dark, luminous, outer, an...
 Free
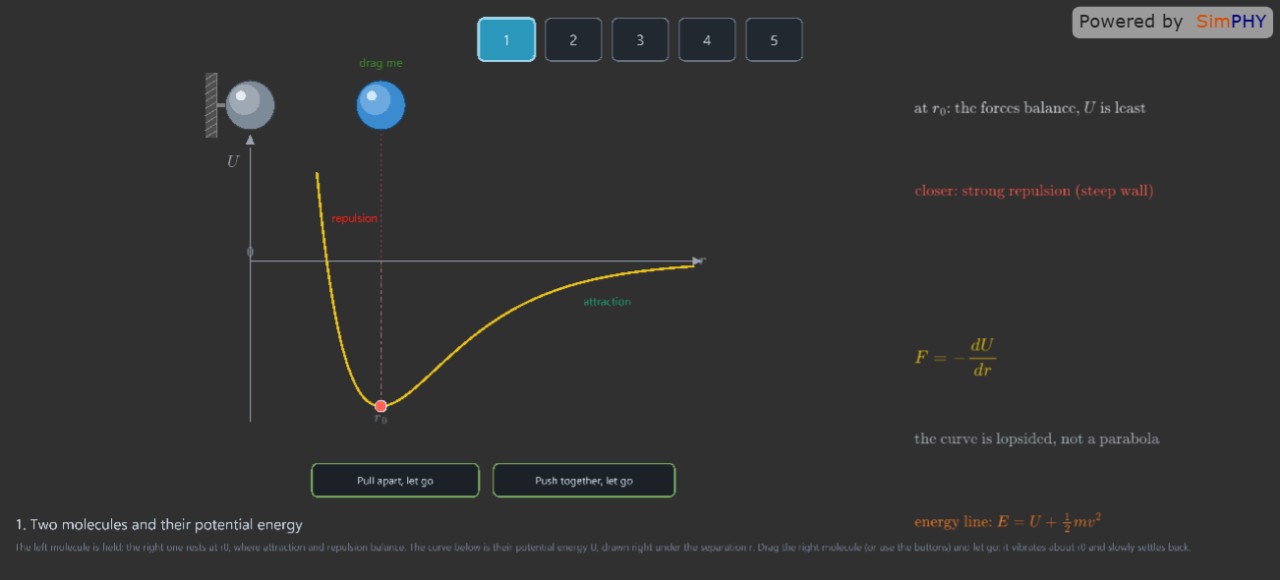
Watch how anharmonic molecular forces cause solids to expand with temp...
 Free
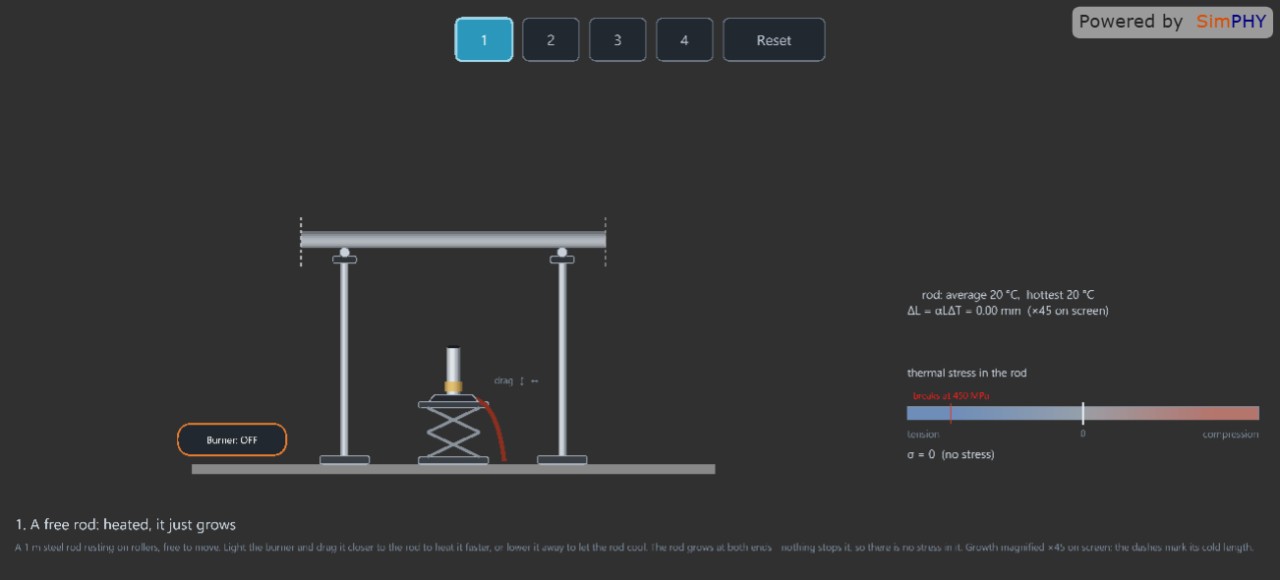
Explore how heating, constraints, and rapid cooling create thermal str...
 Free
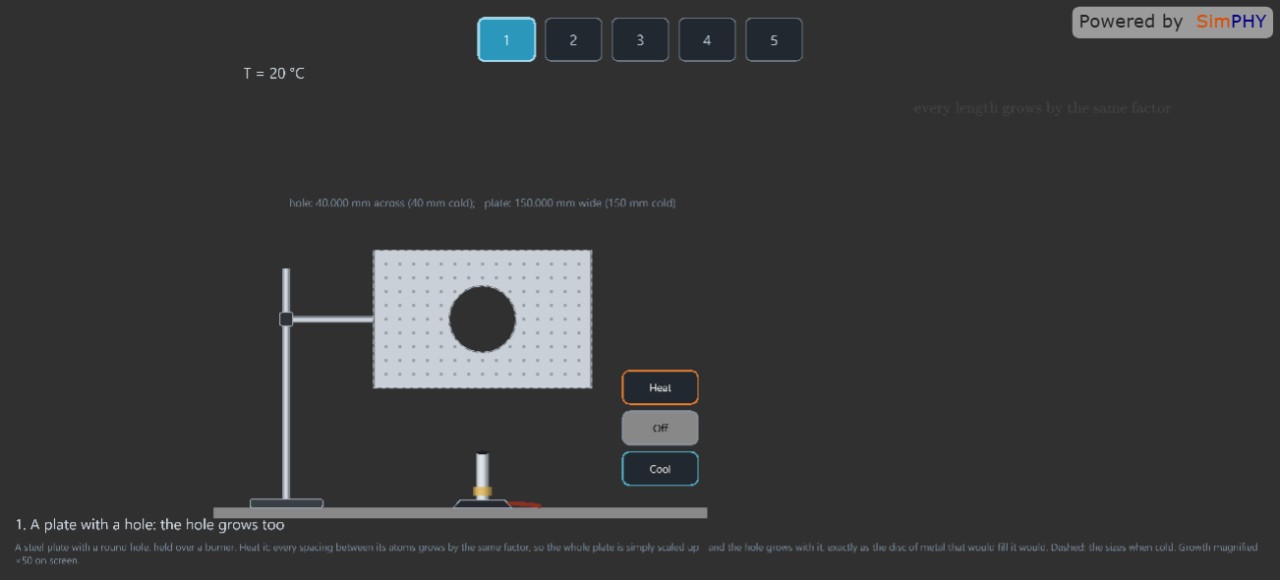
Explore five thermal‑expansion demos: metal plate, glass tube, ball‑ri...