 Free
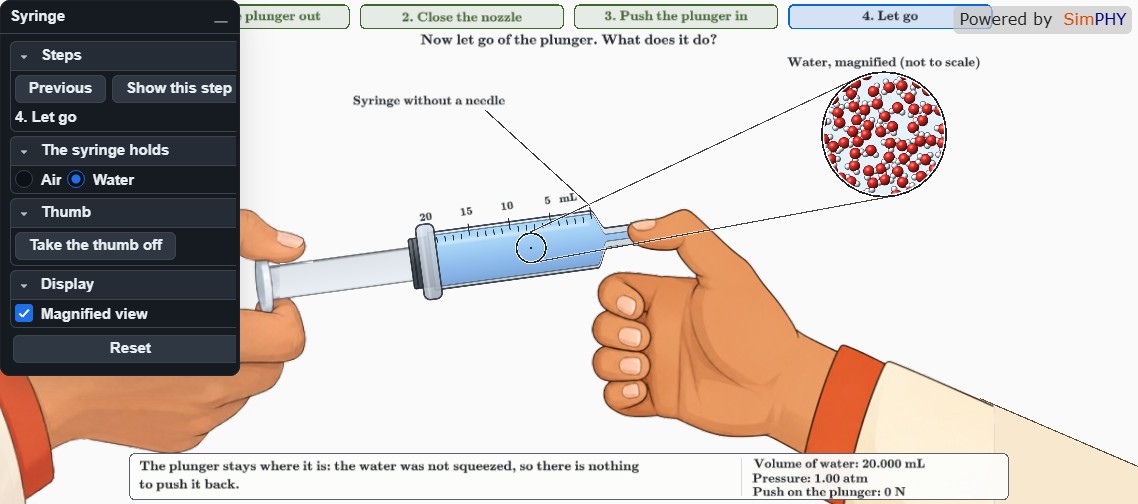
Compressing Air and Water in a Syringe
Fluid MechanicsPull the plunger, seal the tip, and see air compress while water remai...
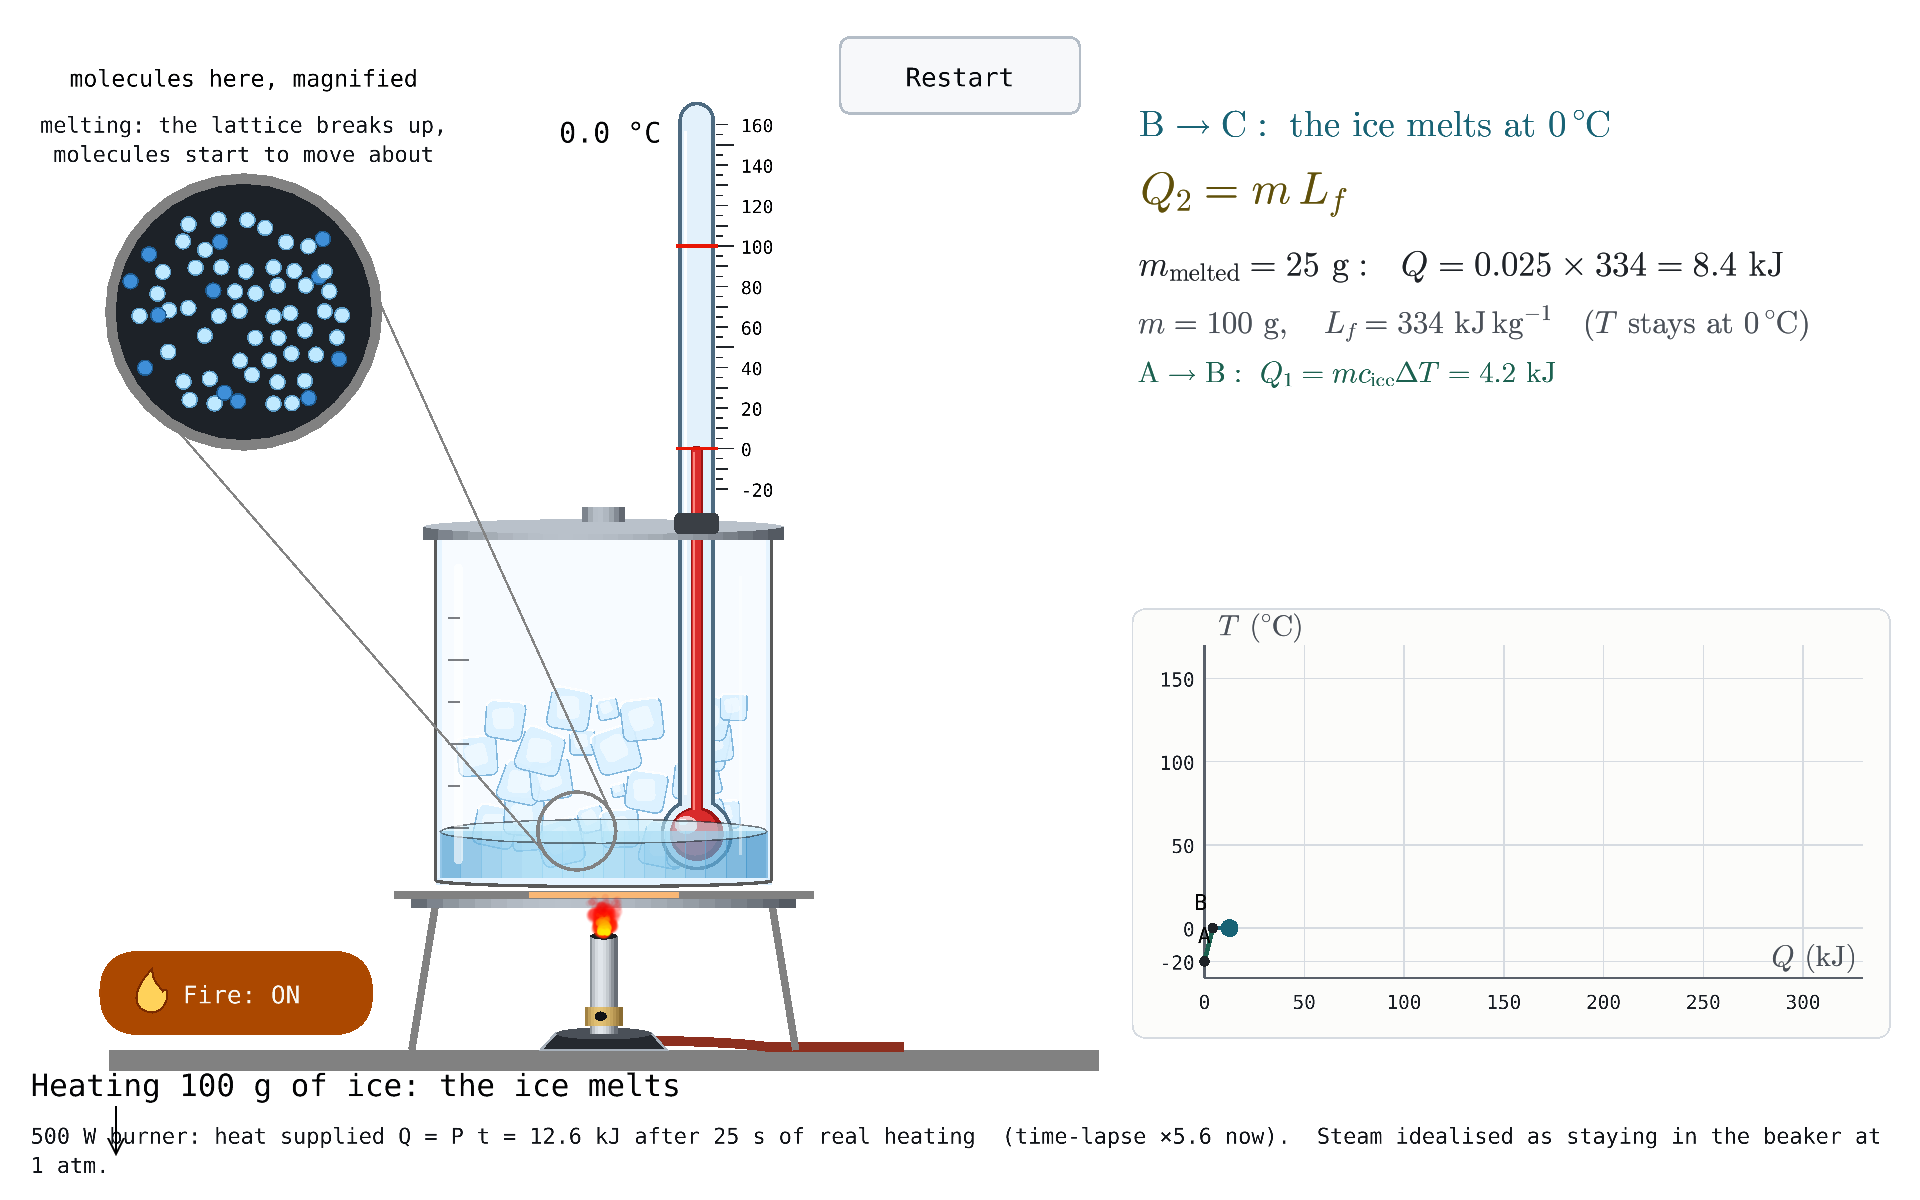
Watch ice warm, melt, water heat, boil, and steam form while the temperature‑heat graph tracks each stage.
The heating curve of water shows how temperature changes as heat is added, highlighting the distinct phases of ice, liquid water, and steam and the plateaus where phase changes occur. Students see the specific‑heat heating of ice and water, the latent‑heat plateaus for melting and boiling, and the final heating of steam.
By pausing or resuming the burner with the Fire button, they can follow each stage on the temperature‑versus‑heat graph and compare it to the calculated values Q = m c ΔT or Q = m L shown on the board. A zoom lens reveals molecular motion in the solid lattice, liquid, and gaseous states.
The simulation reinforces concepts of specific heat capacity, latent heat, energy conservation, and the quantitative relationship between heat supplied and temperature change, providing a visual and quantitative link between macroscopic observations and microscopic behavior.
Free
Pull the plunger, seal the tip, and see air compress while water remai...
 Free
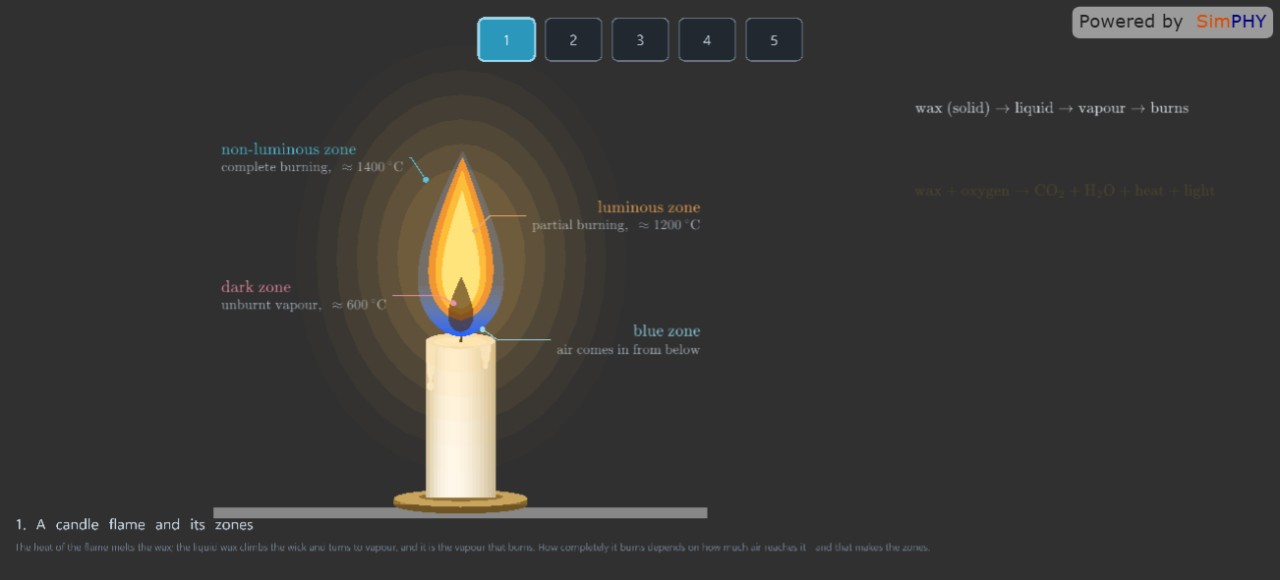
Explore the distinct zones of a candle flame—dark, luminous, outer, an...
 Free
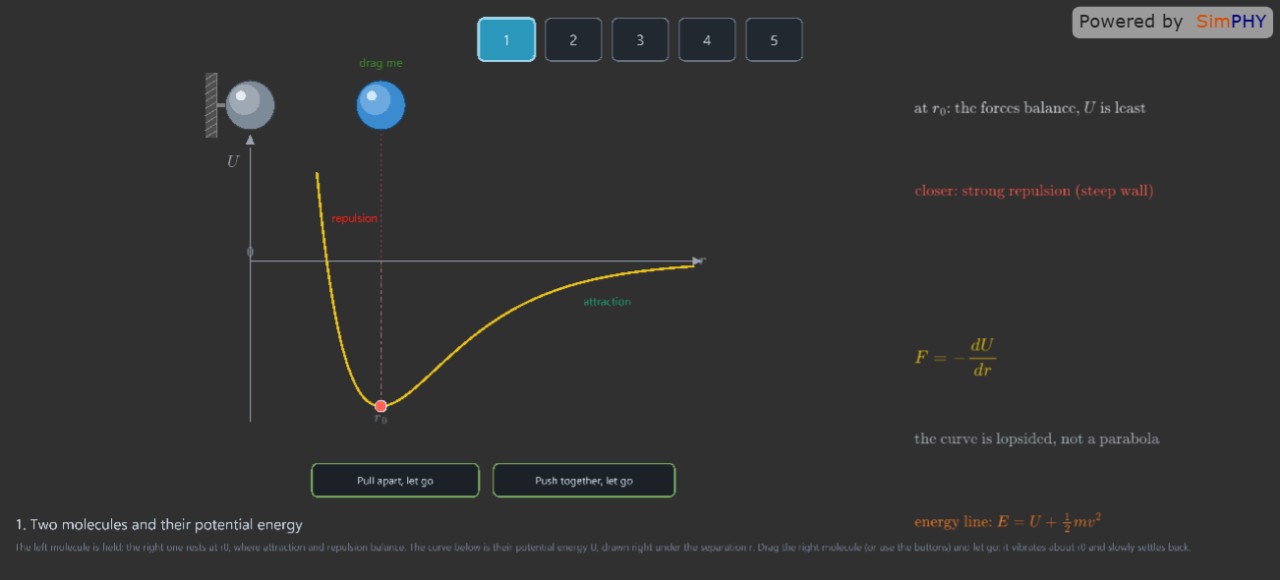
Watch how anharmonic molecular forces cause solids to expand with temp...
 Free
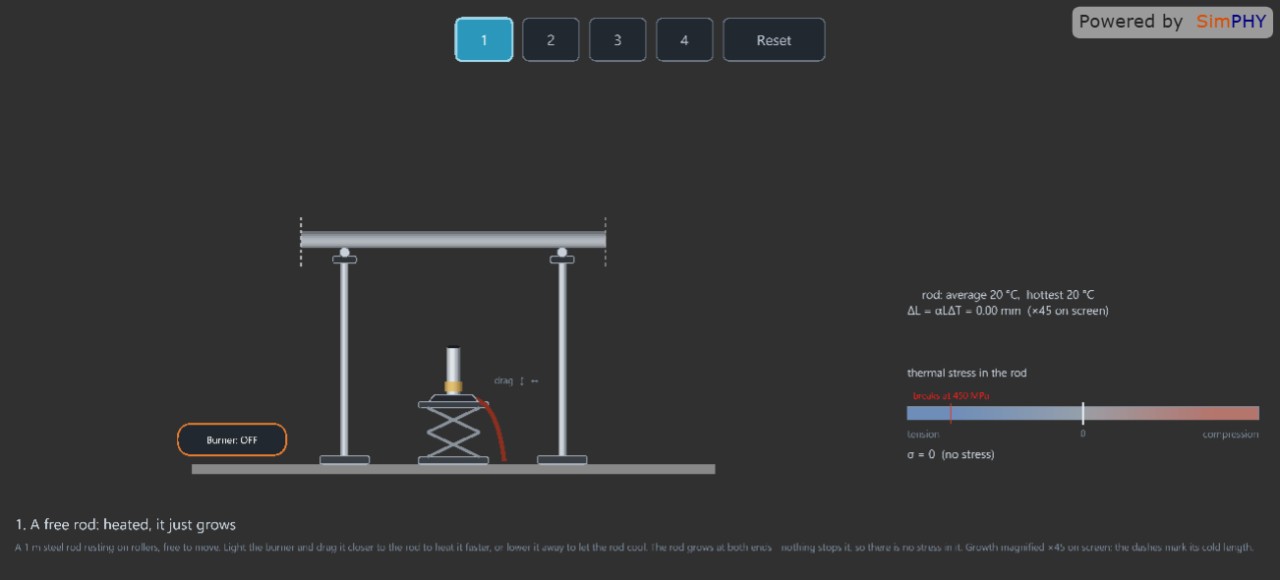
Explore how heating, constraints, and rapid cooling create thermal str...
 Free
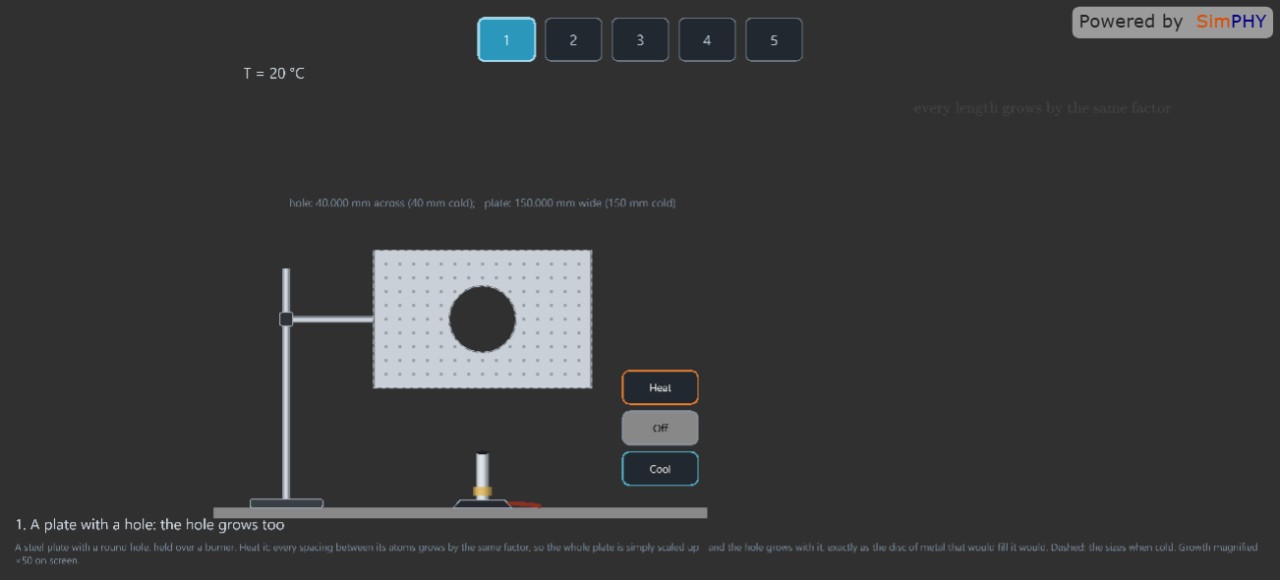
Explore five thermal‑expansion demos: metal plate, glass tube, ball‑ri...
 Free
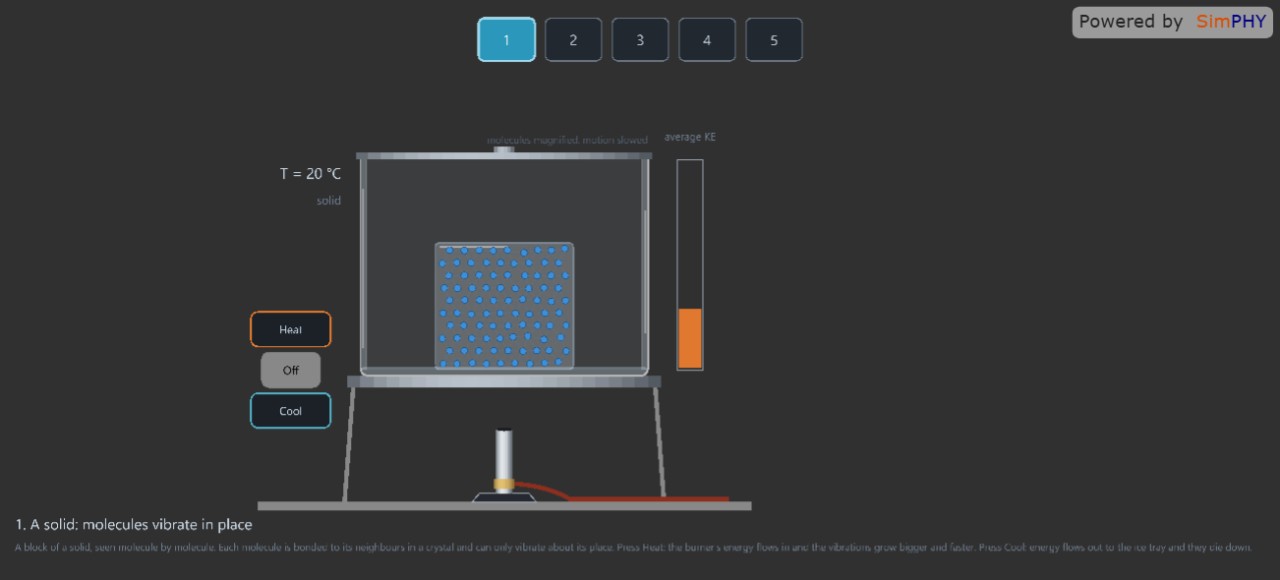
See how heating and cooling change molecular motion in solids, liquids...