 Free
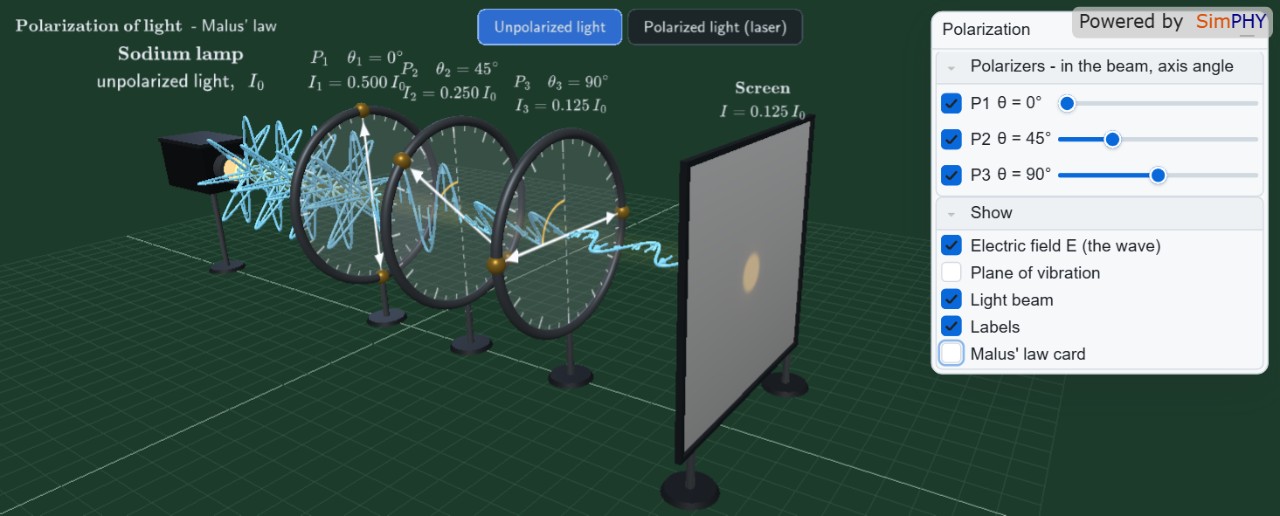
3D Polarization and Malus’s Law
Wave OpticsRotate three polarizers to see how unpolarized or light’s intensity ch...
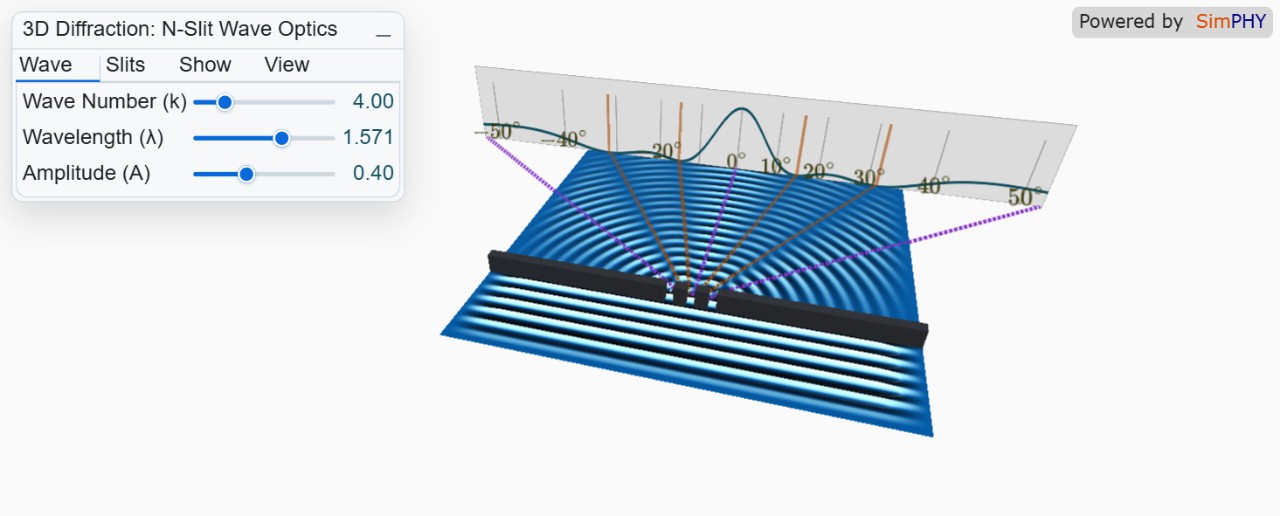
Explore multi‑slit diffraction, see real‑time intensity graphs and ray lines in a 3‑D interactive ripple tank.
The simulation visualises the Huygens–Fresnel principle for a plane wave incident on a barrier with N slits. Each point of every opening emits wavelets that interfere, producing the classic multi‑slit diffraction pattern described by I = I0(sinα/α)²(sinNβ/N sinβ)². The far‑field pattern shows principal maxima, minima, and missing orders as a function of slit spacing, width, and wavelength.
Students can adjust the wavelength (or wave number), amplitude, number of slits, slit width, and slit separation with sliders. They may also toggle the screen, intensity graph, ray diagrams, nodal lines, angle labels, and the LaTeX formula card, and switch between perspective and top‑down views. The simulation updates the water surface and intensity graph in real time, letting learners observe how each parameter reshapes the interference pattern.
By experimenting, students connect the visual pattern to the analytical formulas for diffraction, reinforcing concepts of constructive and destructive interference, angular position of maxima (d sinθ = mλ), and the role of slit geometry. The activity deepens understanding of wave optics, Huygens’ principle, and the transition from near‑field to far‑field behavior.
Free
Rotate three polarizers to see how unpolarized or light’s intensity ch...
 Free
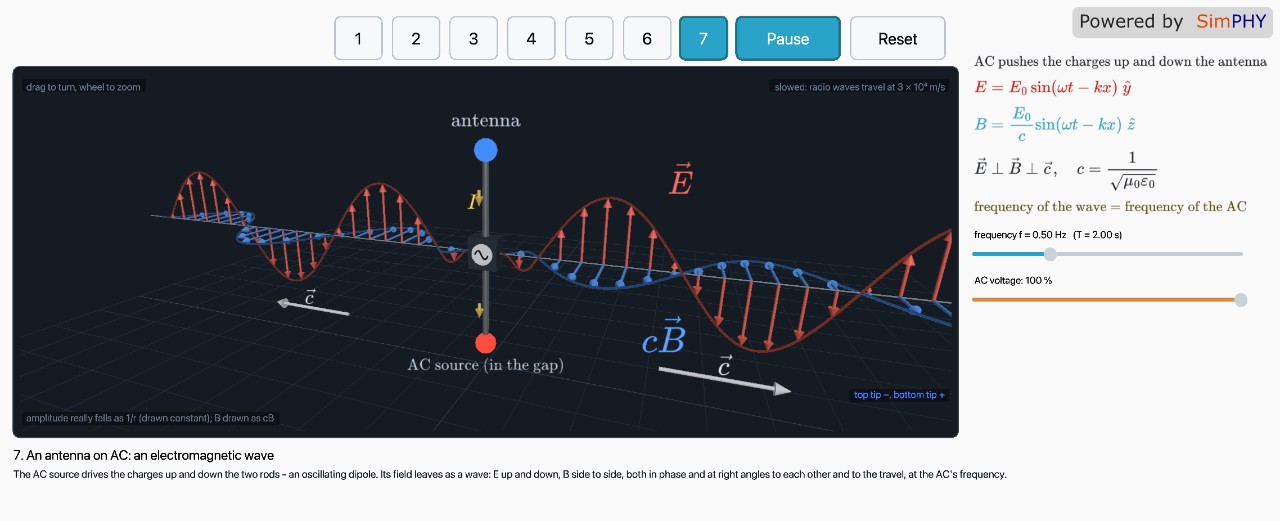
Explore how a vibrating charge creates transverse electric and magneti...
 Free
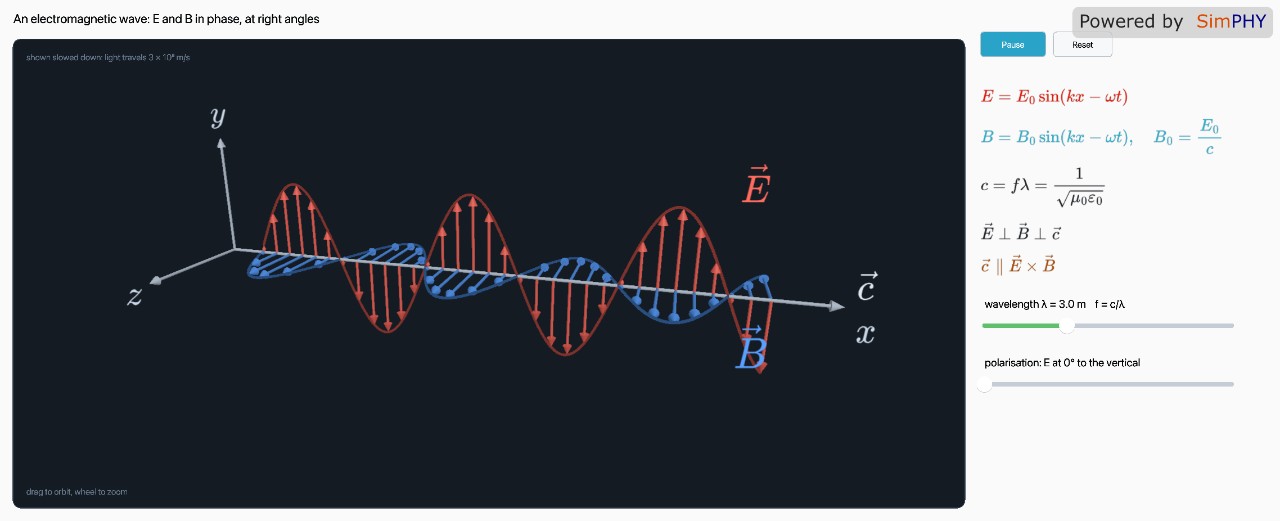
Visualize an electromagnetic wave, see electric and magnetic fields an...
 Free
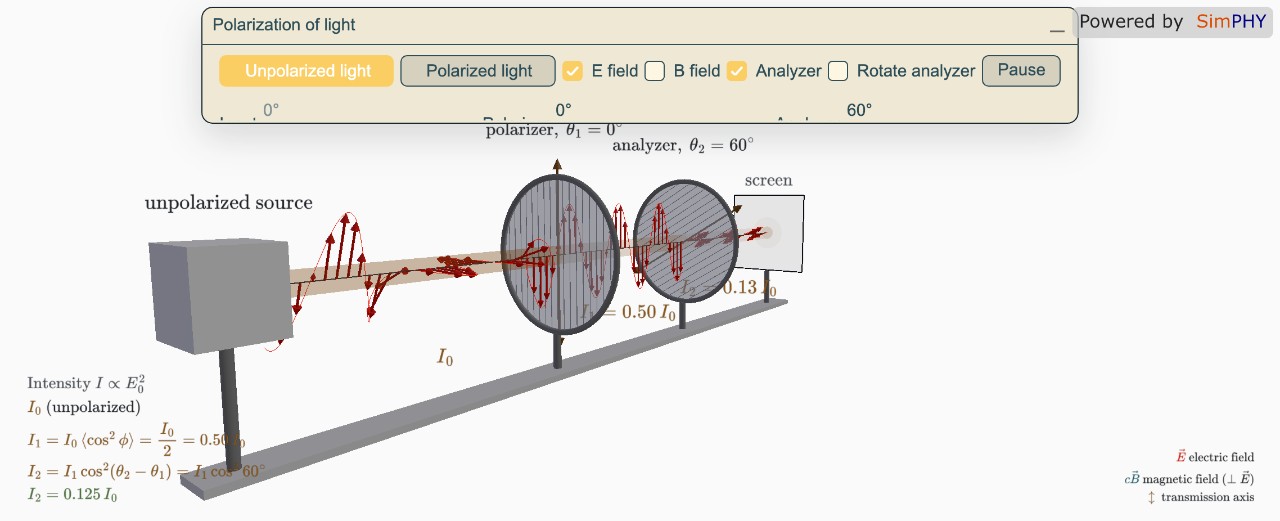
Visualize how a polarizer and analyzer affect polarized and unpolarize...
 Free
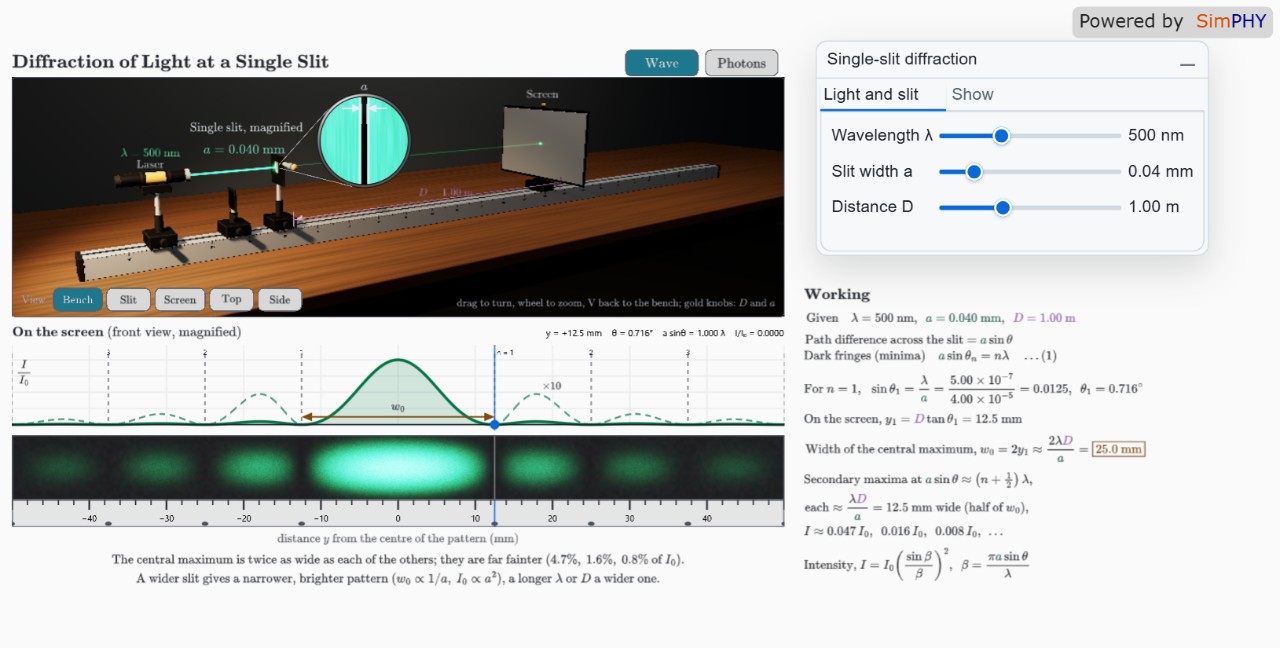
Explore how slit width, wavelength, and distance affect the Fraunhofer...
 Free
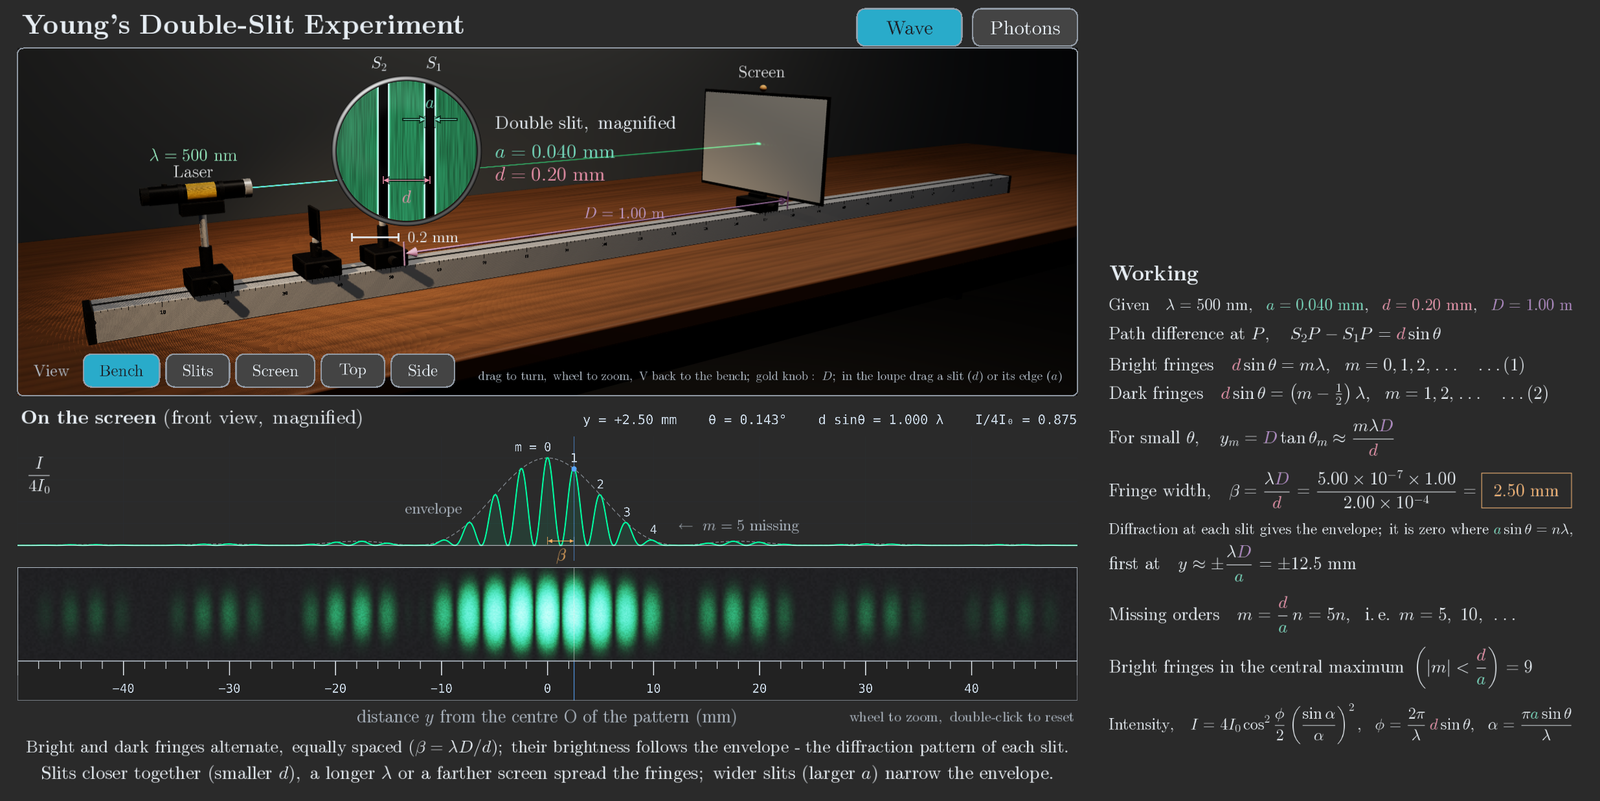
Observe interference and diffraction from a laser through adjustable s...